Reading a spectrum, and what it hides
The most useful measurement in mastering, and an honest account of its blind spots.
Split the audible range into octave bands, measure the average energy in each, and you get a compact description of a record's tonal balance. Ten numbers, roughly 40 Hz to 16 kHz. It is the single most useful measurement in mastering, and it is worth understanding both why it works and where it stops.
Why octaves, not equal steps
Because hearing is logarithmic.
The distance from 100 Hz to 200 Hz sounds like the same musical interval as 1000 Hz to 2000 Hz — an octave, a doubling — even though the second spans nine times more hertz. Slice the spectrum into equal-width slices in hertz and almost all of them land in the treble, where you can least distinguish them, while the entire bass register crowds into the first one.
Octave spacing puts the measurement on the same scale as perception. Each band covers a doubling, each band is roughly one step of musical significance, and ten of them span the range.
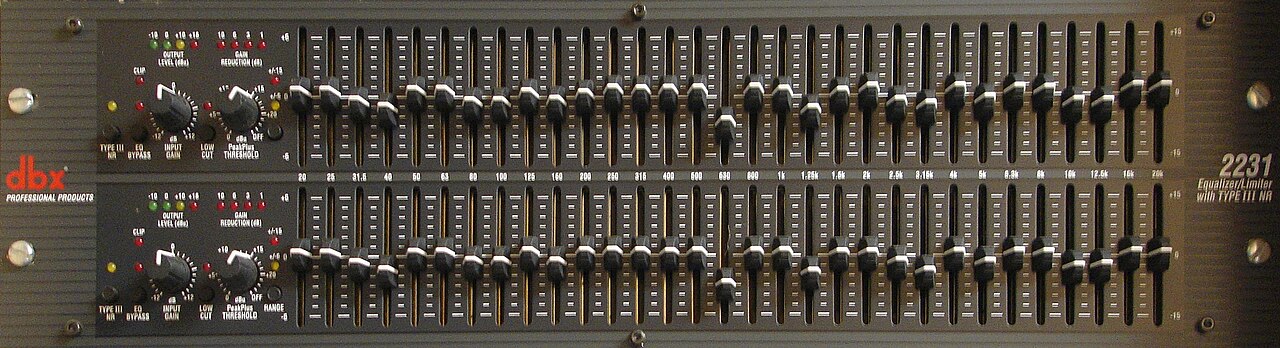
What "flat" isn't
Here is the thing that catches people out: real music is not flat, and a spectrum analyser showing a downward slope is not showing you a problem.
Acoustic energy in almost all recorded music falls steadily as frequency rises. Low frequencies carry far more energy than high ones — a kick drum moves vastly more air than a hi-hat. Measured across the audible range, the drop from the bottom octaves to the top is large, on the order of tens of decibels, and it is present in well-made records from every era and genre.
So "flat" is not the target and never was. A master EQ'd to a genuinely flat octave profile would sound thin and shrill, because you would have removed the natural spectral tilt that every listener's ear expects. What you are comparing against is not a flat line but the tilt characteristic of good records — which is exactly why references beat absolutes.
This is also a real trap in tool-building. Guess that target curve instead of measuring it, and every correction the tool derives is wrong by the size of your error — silently, in the same direction, on every track.
What the measurement genuinely tells you
Whether a record is dark or bright. The slope from the low bands to the high ones is a direct, reliable read on this, and it is the single most common thing people want to fix.
Where the weight sits. A bump around 60–120 Hz reads as a heavy low end; a dip at 200–400 Hz is the classic "scooped" sound that leaves a mix feeling hollow; a rise at 2–5 kHz is presence, and too much of it is harshness and fatigue.
How far apart two recordings are. Compare band by band and the differences are a genuine distance measure. This is what makes reference matching possible at all: subtract one profile from the other and the result is the correction.
When the correction is going to run out. If a dozen bands all need enormous moves, the two recordings are simply not in the same territory, and no chain will bridge that without damage. Knowing this in advance is more valuable than most of what a spectrum tells you.
What it hides
All of the following are invisible to it, and any of them can be the reason a record sounds the way it does.
Time. A spectrum is an average. A track with a thunderous intro and a sparse outro averages to something that describes neither. Two records with identical average profiles can have completely different shapes over four minutes.
Transients. Whether a snare cracks or merely appears is about the envelope — attack and decay — not the frequency content. Compress a drum hard enough to kill its punch and the average spectrum barely moves. This is exactly what the loudness war did, and a spectral comparison would have shrugged at it.
Saturation character. Tape, tube and transistor distortion generate different harmonic series, and those harmonics are a large part of what "warm" means. Ten octave bands are far too coarse to distinguish them; they will land in the same buckets.
Depth and stereo arrangement. How things are placed front-to-back — early reflections, reverb tails, the relationship between the mid and side channels — is not in an octave profile at all. A wide, deep production and a flat, close one can measure identically.
Arrangement itself. A dense wall of guitars and a sparse trio can land on the same tonal balance while sounding nothing alike, because the spectrum measures the sum without caring how many things made it.
What to pair it with
Since so much lives outside the spectrum, a small number of complementary measurements pull their weight:
- ·Crest factor — the distance between peak and average. This is where transient life shows up, and it is the number that would have caught the loudness war.
- ·Dynamic range (LRA) — how much the loudness moves over the track. A record that breathes and one that never lets up are obvious here and invisible in a spectrum.
- ·Side/mid ratio — a coarse but real read on stereo width, and the only one of these that says anything about the image.
Together with an octave profile, these four cover a lot. They still do not cover everything, and nothing does.
The honest summary
An octave profile is a good coarse instrument. It reliably answers "is this too dark", "is this too heavy at the bottom", and "how far apart are these two records" — the questions people actually ask most of the time.
What it cannot do is rank fine differences. If a tool reports that your mix is 87% similar to a reference, the number is a fiction dressed up in a percentage: ten bands do not carry enough information to distinguish 87 from 79, and the qualities separating two records that measure alike are precisely the ones the measurement omits.
Use it to spot extremes and to derive corrections. Do not use it to decide which record is closest to your intention. That question is about intention, and no spectrum has ever measured one.
Try it on your own mix
Wavely shows the whole chain — every stage, every parameter, and why each decision was made. Adjusting it and re-mastering is free on every plan.
Get started free →